According to Behind The Net, the Stars rank 4th from the bottom in the NHL in GF/60 in 5on4 situations with a measly 4.3 GF/60 (Only Carolina, Florida, and Winnipeg have worse Power Play stats in 5on4).
One stat that stood out in my research on this issue is that the Stars don’t have a single player in the Top 50 of PPTm%, which is a measure of a single players PPTOI relative to his team. Alex Ovechkin, not surprisingly, leads the NHL in this stat having been on the ice 93.8% of the time that the Capitals have been on the power play.
Jamie Benn leads the Stars, having been on the ice for 57.9% of the time the Stars have spent on the Power Play. In fact, Tyler Seguin, Ray Whitney, and Alex Chiasson are all above the 50% mark. Whether this is symptomatic of how Lindy Ruff doled out PP minutes in Buffalo or if he even gives this much input on the unit given the fact that one of Curt Fraser’s duties as an assistant coach is coaching the Power Play units is anybody’s guess.
In fact, this could simply be a case where Ruff and Fraser are throwing their top 6 forwards and offensive defensemen into a line blender hoping to find the magic formula. And once they find it, they’ll stay with consistent lines on the power play moving forward.
Which speaking of lines, I’ll get to that in a bit.
In the meantime…
|
PP
|
G
|
GF/60
|
|
|
Total
|
155:32
|
10
|
3.002745566
|
|
Home
|
65:31
|
1
|
0.915797507
|
|
Away
|
90:01
|
9
|
5.998889095
|
|
Differential
|
-8
|
-5.083091588
|
It’s obviously no secret that Dallas has horribly struggled on the power play at home. But these numbers put in context just how much of a struggle it is.
Yes, they’ve played 5 more games on the road than they have at home as well as been on the man advantage for almost 25 minutes.
But a 0.9158 GF/60 is what it is. And so is a differential of more than 5 GF/60.
And the trend remains the same as we delve deeper into the shot statistics.
|
PPSF
|
SF/60
|
PPMSF
|
PPBSF
|
PPShAttF
|
PPShAttF/60
|
|
|
Total
|
111
|
42.82
|
50
|
51
|
212
|
81.78311
|
|
Home
|
33
|
30.221
|
23
|
23
|
79
|
72.348
|
|
Away
|
78
|
51.99
|
27
|
28
|
133
|
88.65025
|
|
Differential
|
-45
|
-21.77
|
-4
|
-5
|
-54
|
-16.3022
|
What to make of these numbers?
Well, the first thing that jumps out to me is SF/60 differential. Bear in mind you can fit 20 two minute minors in an hour. So a differential of over 20 shots means the Stars are roughly averaging one shot less per home power play than they are on the road.
So is it a case where the Stars aren’t getting as much attack zone time on the power play at home than they are on the road? Well, that’s hard to quantify.
Once upon a time, the NHL used to track attack zone time. And if I recall correctly, they broke it down by ES, PP, and SH situations.
What we can do is look at the overall shot attempts, which encompasses all goals, shots, missed shots, and blocked shots. As the table shows, the Stars are averaging about 16 attempts less per 60 minutes at home than they are on the road.
Getting to the question of whether it’s a case where the Stars aren’t enjoying as much attack zone time at home than the road or if the shots aren’t getting through, these stats would suggest it’s fair to say that the blame would tilt heavily to shots missing the net or not getting through with a slice of less attack zone time.
Now let me go back to the lines. Which I’ll present without comment as an image (since it includes databars in Excel).
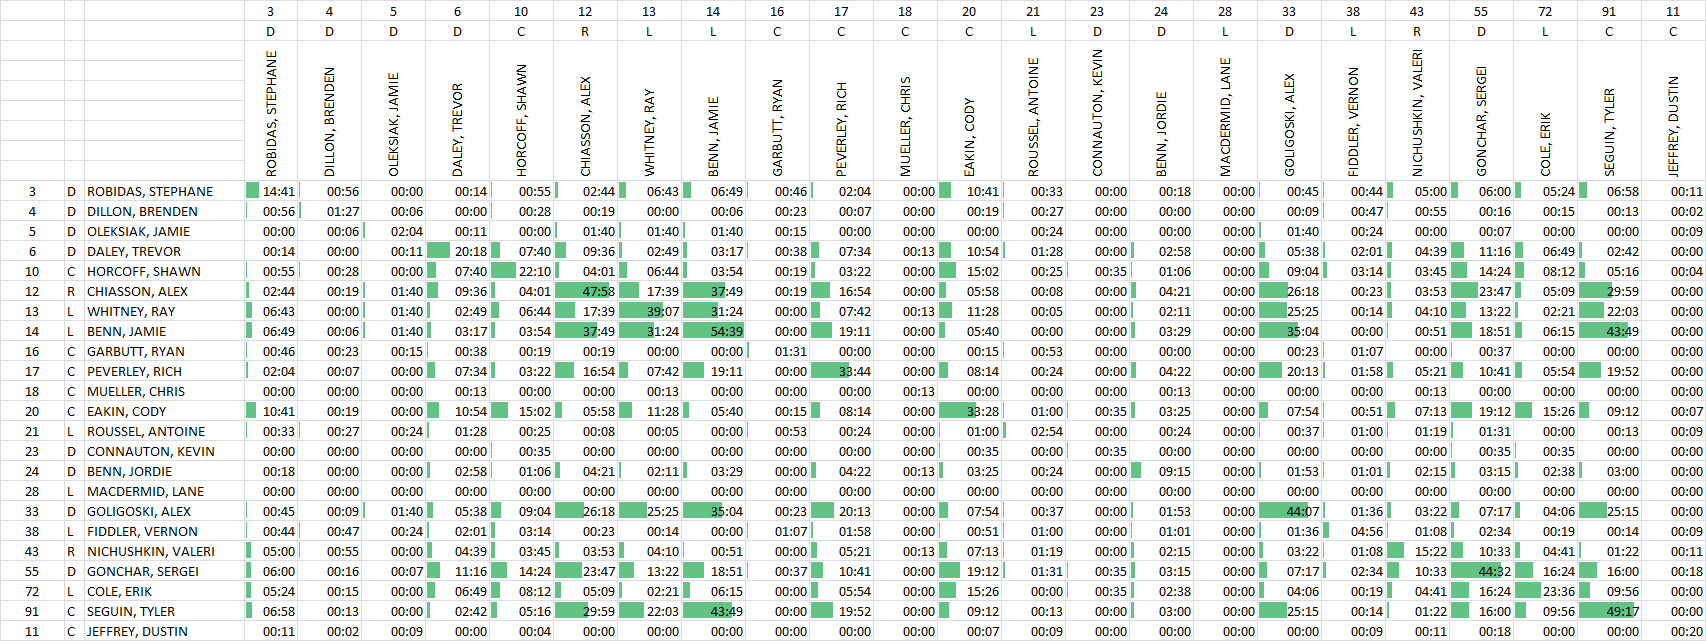
And finally, the individual differentials, which I limited to those who have received at least 10 minutes of ice time on the power play this season.
|
Differentials
|
|||||||||||||||
|
Power Play
|
|||||||||||||||
|
No
|
Pos
|
Name |
G
|
A1
|
A2
|
P
|
G/60
|
A/60
|
P/60
|
Shots
|
Miss
|
Block
|
Shots/60
|
Miss/60
|
Block/60
|
|
3
|
D
|
ROBIDAS, STEPHANE |
1
|
0
|
0
|
1
|
4.337349398
|
0
|
0
|
3
|
2
|
-1
|
13.01204819
|
8.674698795
|
-15.72052402
|
|
6
|
D
|
DALEY, TREVOR |
0
|
0
|
-1
|
-1
|
0
|
0
|
-4.639175258
|
-1
|
3
|
1
|
-4.750048629
|
13.47403229
|
4.528301887
|
|
10
|
C
|
HORCOFF, SHAWN |
-2
|
0
|
0
|
-2
|
-5.930807249
|
0
|
0
|
-1
|
0
|
0
|
0.577473337
|
0
|
0
|
|
12
|
R
|
CHIASSON, ALEX |
-2
|
0
|
-2
|
-4
|
-2.490487721
|
0
|
-2.490487721
|
-5
|
3
|
-1
|
-2.552171627
|
6.185096697
|
-0.632902581
|
|
13
|
L
|
WHITNEY, RAY |
0
|
-1
|
-1
|
-2
|
0
|
-1.789264414
|
-1.789264414
|
-6
|
6
|
6
|
-10.74889286
|
10.69566734
|
10.69123188
|
|
14
|
L
|
BENN, JAMIE |
0
|
-2
|
-1
|
-3
|
0
|
-2.330097087
|
-1.165048544
|
2
|
6
|
3
|
5.684899408
|
9.97233777
|
5.358924698
|
|
17
|
C
|
PEVERLEY, RICH |
0
|
0
|
0
|
0
|
0
|
0
|
0
|
-7
|
-3
|
-3
|
-7.024480334
|
-3.330776215
|
-2.209779965
|
|
20
|
C
|
EAKIN, CODY |
-2
|
0
|
1
|
-1
|
-4.466501241
|
0
|
2.457337884
|
-2
|
-2
|
2
|
-4.018326713
|
-4.242413977
|
4.914675768
|
|
24
|
D
|
BENN, JORDIE |
-1
|
0
|
-1
|
-2
|
-4.306220096
|
0
|
-4.306220096
|
-4
|
1
|
0
|
-17.22488038
|
13.23529412
|
0
|
|
33
|
D
|
GOLIGOSKI, ALEX |
-1
|
-1
|
0
|
-2
|
-1.41955836
|
-1.41955836
|
0
|
3
|
1
|
-1
|
9.286137108
|
2.137767221
|
2.171485947
|
|
43
|
R
|
NICHUSHKIN, VALERI |
0
|
-1
|
0
|
-1
|
0
|
-3.010033445
|
0
|
0
|
-1
|
0
|
3.466099118
|
-1.276983886
|
0
|
|
55
|
D
|
GONCHAR, SERGEI |
0
|
0
|
-3
|
-3
|
0
|
0.43119899
|
-4.155444402
|
0
|
-3
|
1
|
2.155994951
|
-4.155444402
|
2.678745105
|
|
72
|
L
|
COLE, ERIK |
0
|
-1
|
-1
|
-2
|
0
|
-2.051282051
|
-2.051282051
|
-5
|
0
|
-4
|
-10.25641026
|
0
|
-8.205128205
|
|
91
|
C
|
SEGUIN, TYLER |
-2
|
-2
|
0
|
-4
|
-2.356020942
|
-2.356020942
|
0
|
-5
|
-4
|
-1
|
-1.217219826
|
-2.37562562
|
0.574301728
|
Quite clear that from a pure shots standpoint, Stephane Robidas, Jamie Benn, and Alex Goligoski are the only Stars who have consistently performed better at home on the power play than on the road while Jordie Benn and Erik Cole have probably seen the biggest drop off from road to home.
If there’s a sliver of good news, the law of averages combined with a few homestands to make up for the discrepancy in road games to home games should help. And it better considering the Stars injuries and just how stacked the West is this year.